Estimate variance of measured Licor values
estimate_licor_variance.RdEstimates variance and standard deviation of the net CO2 assimilation rate as measured by a Licor Li-6800 or similar portable photosynthesis system.
Usage
estimate_licor_variance(
    exdf_obj,
    sd_CO2_r,
    sd_CO2_s,
    sd_flow,
    sd_H2O_r,
    sd_H2O_s,
    a_column_name = 'A',
    co2_r_column_name = 'CO2_r',
    co2_s_column_name = 'CO2_s',
    corrfact_column_name = 'CorrFact',
    flow_column_name = 'Flow',
    h2o_r_column_name = 'H2O_r',
    h2o_s_column_name = 'H2O_s',
    s_column_name = 'S'
  )
Arguments
- exdf_obj
An
exdfobject containing gas exchange data.- sd_CO2_r
The standard deviation of reference CO2 concentrations (
CO2_r) in units ofmicromol mol^(-1).- sd_CO2_s
The standard deviation of sample CO2 concentrations (
CO2_s) in units ofmicromol mol^(-1).- sd_flow
The standard deviation of flow rates (
Flow) in units ofmicromol s^(-1).- sd_H2O_r
The standard deviation of reference H2O concentrations (
H2O_r) in units ofmmol mol^(-1).- sd_H2O_s
The standard deviation of reference H2O concentrations (
H2O_r) in units ofmmol mol^(-1).- a_column_name
The name of the column in
exdf_objthat contains the net CO2 assimilation rate inmicromol m^(-2) s^(-1).- co2_r_column_name
The name of the column in
exdf_objthat contains the CO2 concentration in the reference line inmicromol mol^(-1).- co2_s_column_name
The name of the column in
exdf_objthat contains the CO2 concentration in the reference line inmicromol mol^(-1).- corrfact_column_name
The name of the column in
exdf_objthat contains the leak correction factor (dimensionless)- flow_column_name
The name of the column in
exdf_objthat contains the flow rate of air entering the leaf chamber inmicromol s^(-1).- h2o_r_column_name
The name of the column in
exdf_objthat contains the H2O concentration in the reference line inmmol mol^(-1).- h2o_s_column_name
The name of the column in
exdf_objthat contains the H2O concentration in the sample line inmmol mol^(-1).- s_column_name
The name of the column in
exdf_objthat contains the leaf chamber area incm^2.
Details
Uses the error propogation formula to calculate the influence of the variance
in CO2_r, CO2_s, etc on the variance of A, as calculated
by a Licor LI-6800.
Value
An exdf object based on exdf_obj that includes additional
columns representing the standard deviation of A measurements
(sd_A), and the individual terms comprising the total variance of
A, such as var_CO2_r, var_CO2_s, etc.
Examples
# Read an example Licor file included in the PhotoGEA package
licor_file <- read_gasex_file(
  PhotoGEA_example_file_path('c3_aci_1.xlsx')
)

# Define a new column that uniquely identifies each curve
licor_file[, 'species_plot'] <-
  paste(licor_file[, 'species'], '-', licor_file[, 'plot'] )

# Organize the data
licor_file <- organize_response_curve_data(
    licor_file,
    'species_plot',
    c(9, 10, 16),
    'CO2_r_sp'
)

# Estimate variance in measured A values
licor_file <- estimate_licor_variance(
  licor_file,
  sd_CO2_r = 1,
  sd_CO2_s = 0.1,
  sd_flow = 0.2,
  sd_H2O_r = 0.5,
  sd_H2O_s = 0.1
)

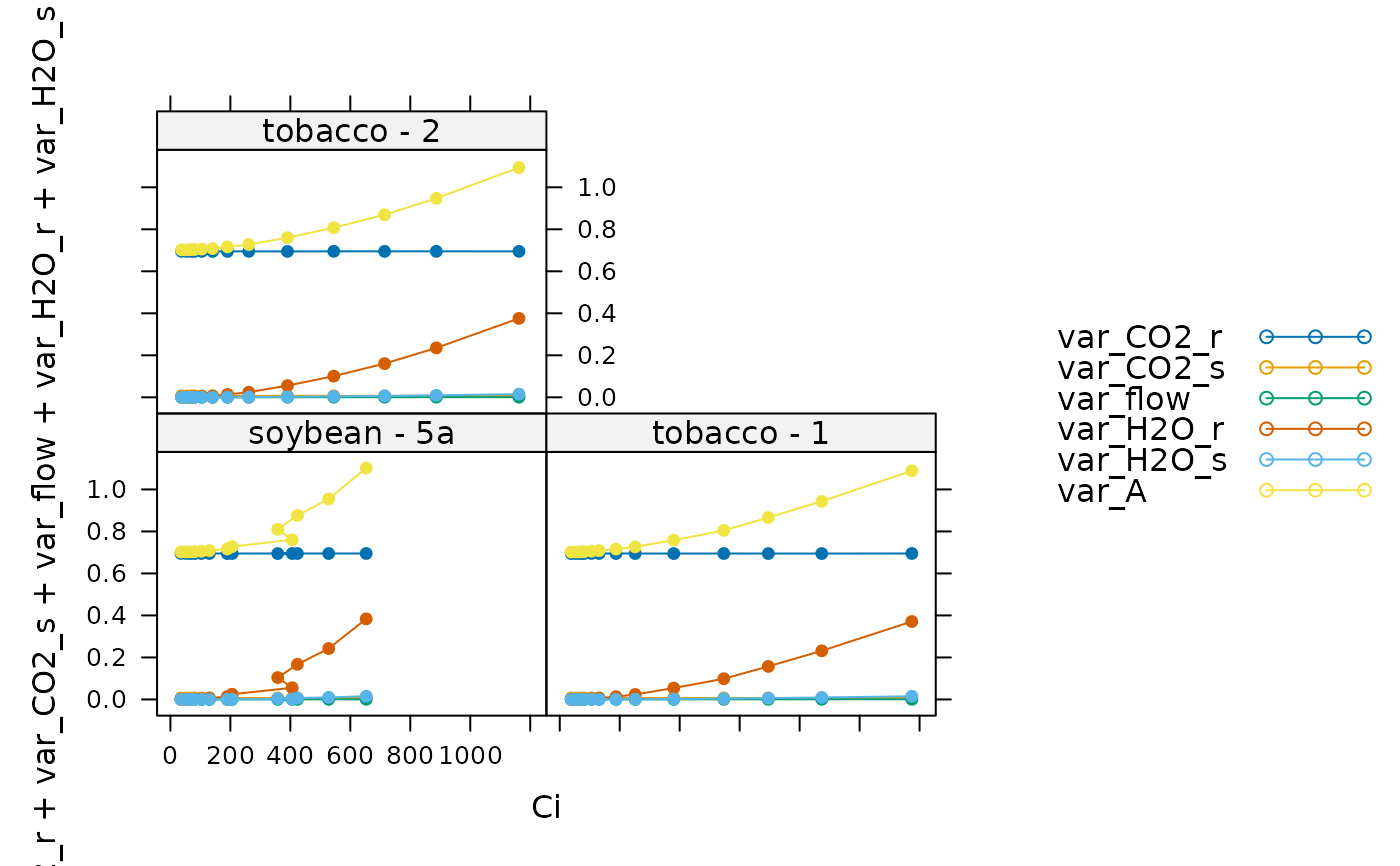
# Plot each component of the total variance of A
lattice::xyplot(
    var_CO2_r + var_CO2_s + var_flow + var_H2O_r + var_H2O_s + var_A ~ Ci | species_plot,
    data = licor_file$main_data,
    type = 'b',
    pch = 16,
    auto = TRUE
)


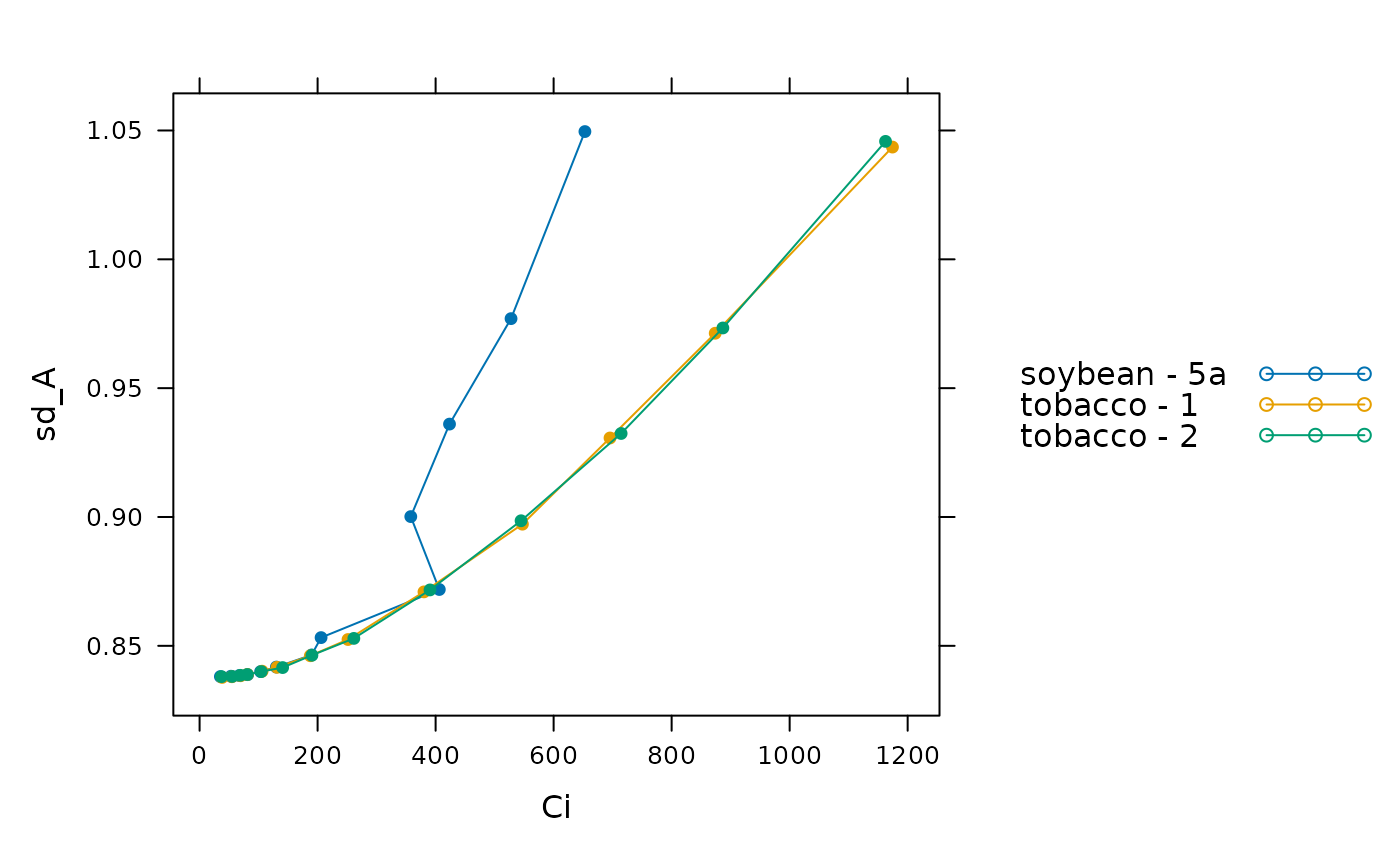
# Plot the standard deviation of A
lattice::xyplot(
    sd_A ~ Ci,
    group = species_plot,
    data = licor_file$main_data,
    type = 'b',
    pch = 16,
    auto = TRUE
)
