Convert ID column to a factor with a suitable ordering
factorize_id_column.RdConverts an ID column to a factor with a suitable ordering. In particular,
this function will ensure that any IDs beginning with WT (or any
other control group name, case-insensitive) will be ordered before other
values. This is helpful when plotting results according to genotype.
Usage
factorize_id_column(x, ...)

  # S3 method for class 'character'
factorize_id_column(x, control_group_name = 'WT', ...)

  # S3 method for class 'data.frame'
factorize_id_column(x, id_column_name, control_group_name = 'WT', ...)

  # S3 method for class 'exdf'
factorize_id_column(x, id_column_name, control_group_name = 'WT', ...)
Arguments
- x
Object to be ordered.
- id_column_name
When
xis adata.frameorexdf, this argument specifies the column within the table that should be ordered.- control_group_name
A string specifying the name of the control group, such as
'WT'or'control'.- ...
Additional arguments (currently unused).
Value
factorize_id_column.character returns the character vector as a
factor with an appropriate ordering.
factorize_id_column.data.frame and factorize_id_column.exdf
return a copy of the original table, where one column (specified by
id_column_name) has been converted to a factor with an
appropriate ordering.
Details
To choose an ordering, each unique identifier is split into three components:
an initial control_group_name (if present), a final numeric value, and
any other content in between these two. Then, the identifiers are sorted
according to these three values, in order of control_group_name ->
other content -> numeric value. Note that capitalization of any initial
control_group_name values will be standardized to match the
user-specified version.
This system works well with identifiers that represent genotypes/events, or that combine genotype/event with a replicate number.
Examples
# Identifiers that represent genotypes
genotype_ids <- c('4', 'control', '2', 'CONTROL', '8')
factorize_id_column(genotype_ids, control_group_name = 'control')
#> [1] 4 control 2 control 8
#> Levels: control 2 4 8
# Identifiers that represent `genotype - replicate` values
replicate_ids <- c('4 - 4', 'wT - 2', 'a - 2', 'WT - 1', '4 - 8', 'wt - 9')
factorize_id_column(replicate_ids)
#> [1] 4 - 4 WT - 2 a - 2 WT - 1 4 - 8 WT - 9
#> Levels: WT - 1 WT - 2 WT - 9 4 - 4 4 - 8 a - 2
# Data frame
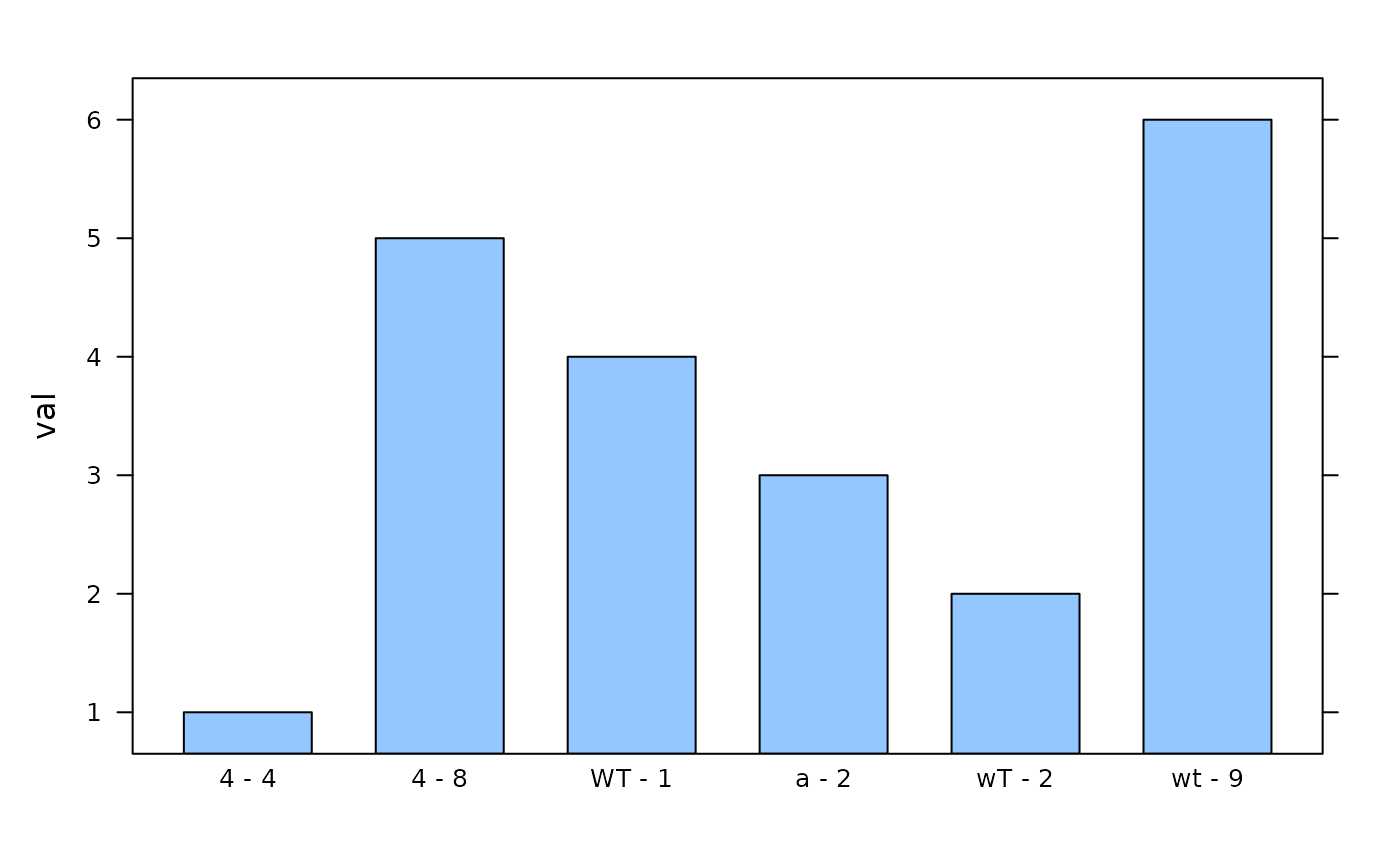
dat <- data.frame(replicate_id = replicate_ids, val = seq_along(replicate_ids))
# Display data in bar chart - note the order of the replicates
lattice::barchart(val ~ replicate_id, data = dat)
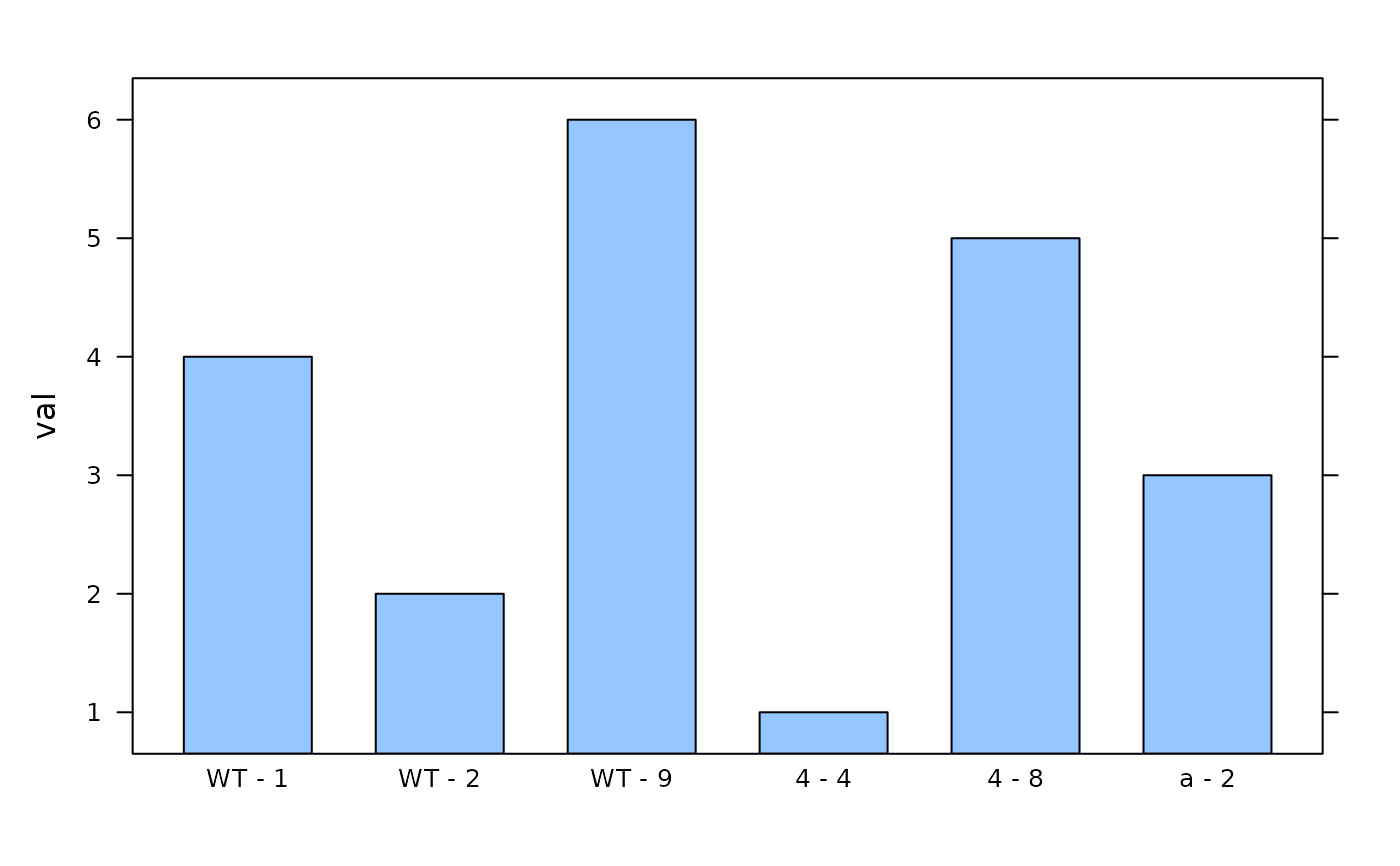
 # Display factorized data in bar chart - note the order of the replicates
lattice::barchart(val ~ replicate_id, data = factorize_id_column(dat, 'replicate_id'))
# Display factorized data in bar chart - note the order of the replicates
lattice::barchart(val ~ replicate_id, data = factorize_id_column(dat, 'replicate_id'))
 # Extended data frame
exdf_obj <- exdf(dat, units = data.frame(replicate_id = '', val = 'm / s'))
exdf_obj <- factorize_id_column(exdf_obj, 'replicate_id')
exdf_obj[, 'replicate_id']
#> [1] 4 - 4 WT - 2 a - 2 WT - 1 4 - 8 WT - 9
#> Levels: WT - 1 WT - 2 WT - 9 4 - 4 4 - 8 a - 2
# Extended data frame
exdf_obj <- exdf(dat, units = data.frame(replicate_id = '', val = 'm / s'))
exdf_obj <- factorize_id_column(exdf_obj, 'replicate_id')
exdf_obj[, 'replicate_id']
#> [1] 4 - 4 WT - 2 a - 2 WT - 1 4 - 8 WT - 9
#> Levels: WT - 1 WT - 2 WT - 9 4 - 4 4 - 8 a - 2